Water Security as a diagram
When working at Newcastle University on Water Security, I felt the complexity of that concept could be reduced to a simpler form taking inspiration from system diagrams. The idea was to place 3 elements at the center of the diagram. Nature(N), Population (P) mediated by infrastructure (I). Additionally these 3 elements would have close relation to enabling factors such as governance (G) and resources (R). This part of the diagram represent the system at a local level. This can be thought as a region, village, basin, it would depend on local conditions.
This “local system” would then have external stressors such as climate change (CC), political change (PL), growth (GU) and economic changes (EC).
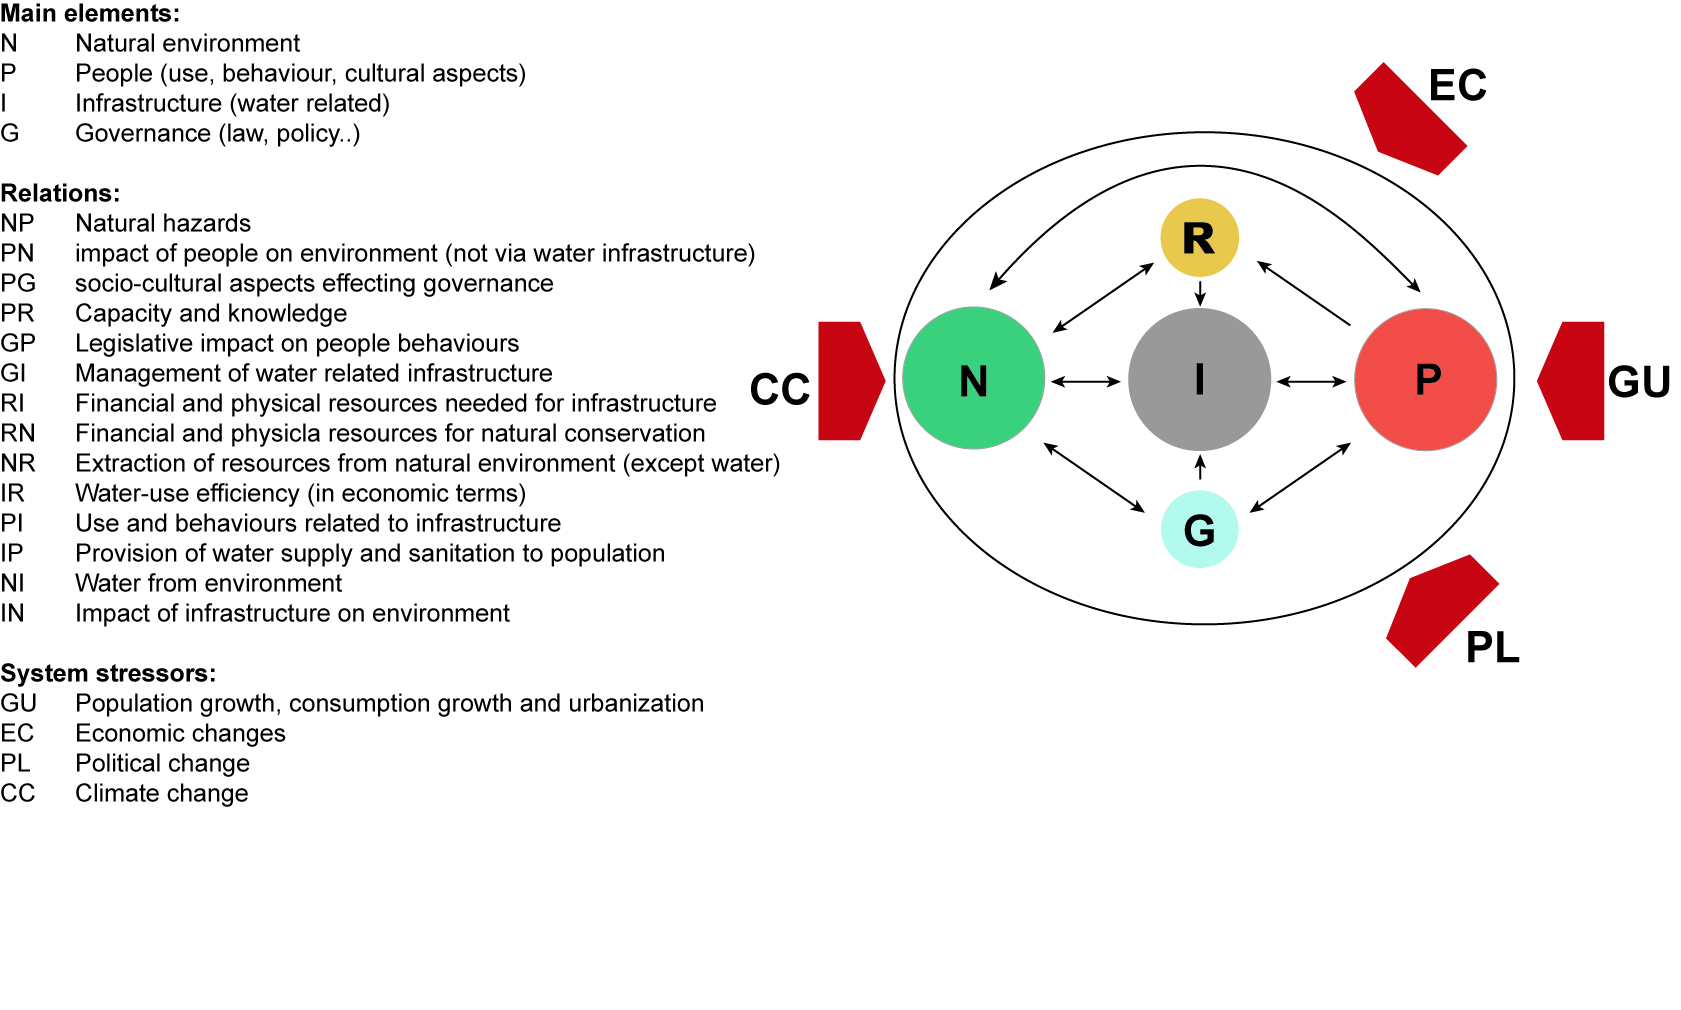
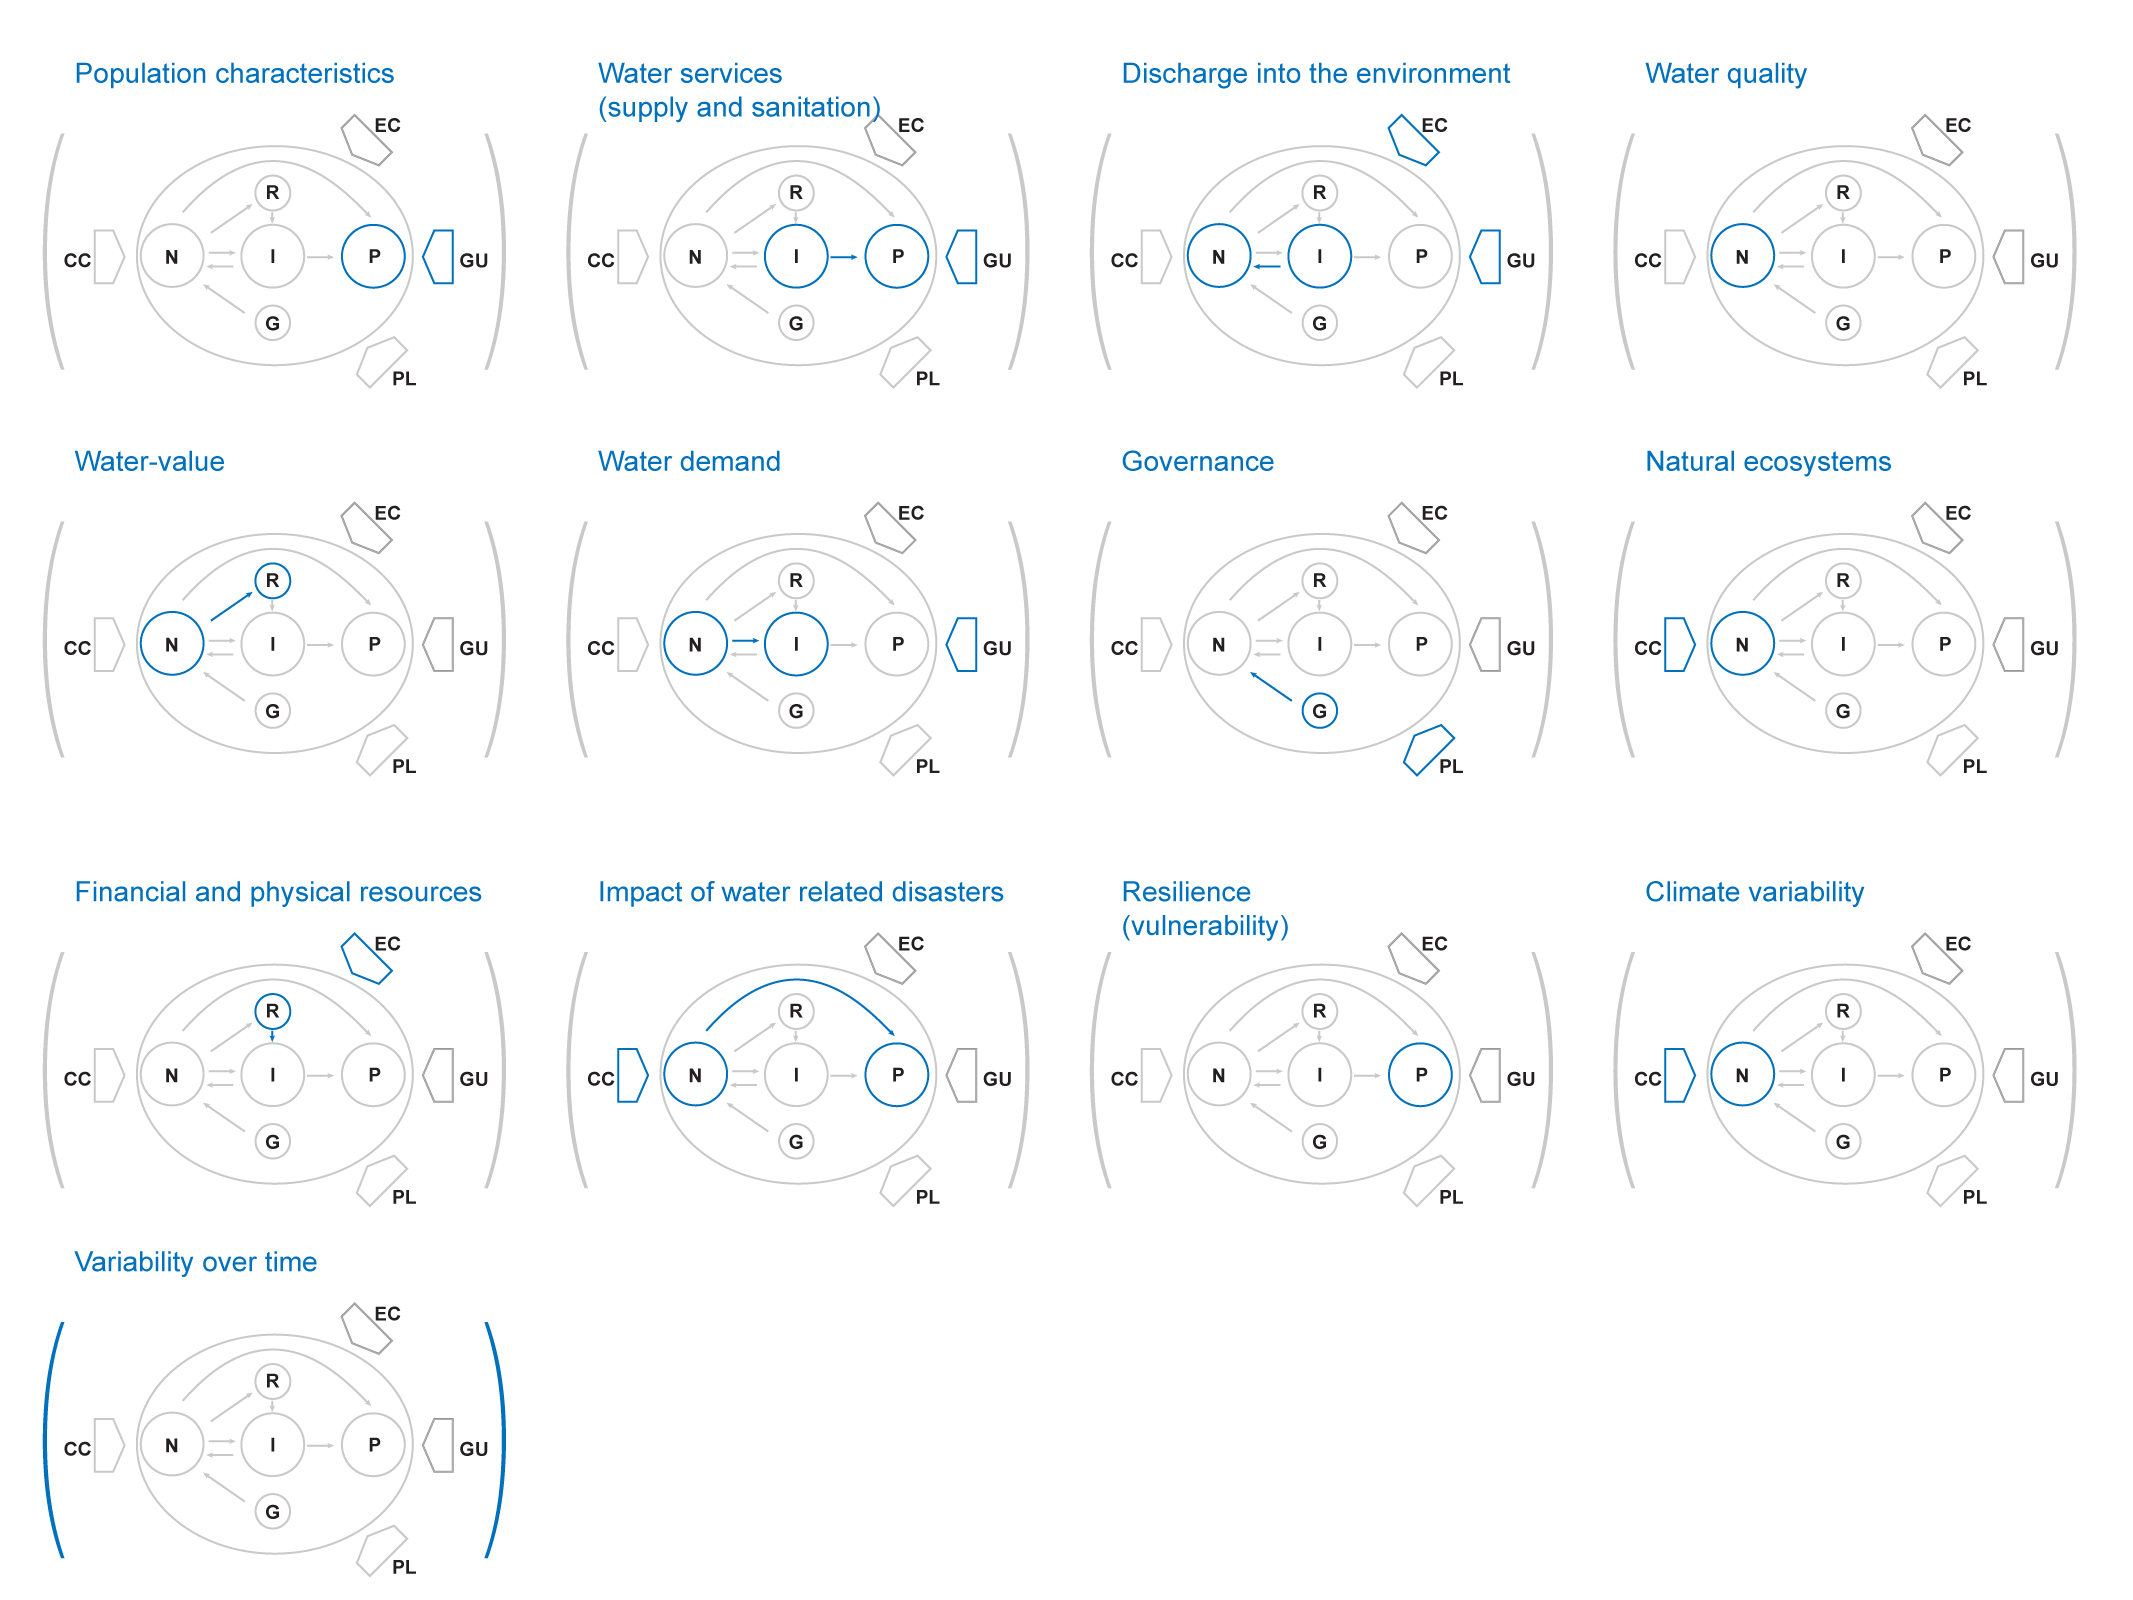
What is perhaps more interesting is that the relation between these nodes can describe particular situations. For example, nature-population (N-P) represent natural hazards on one way and human threat to the natural environment. Resources given to infrastructure is described by R-I. User behaviours between population and infrastructure (P-I).
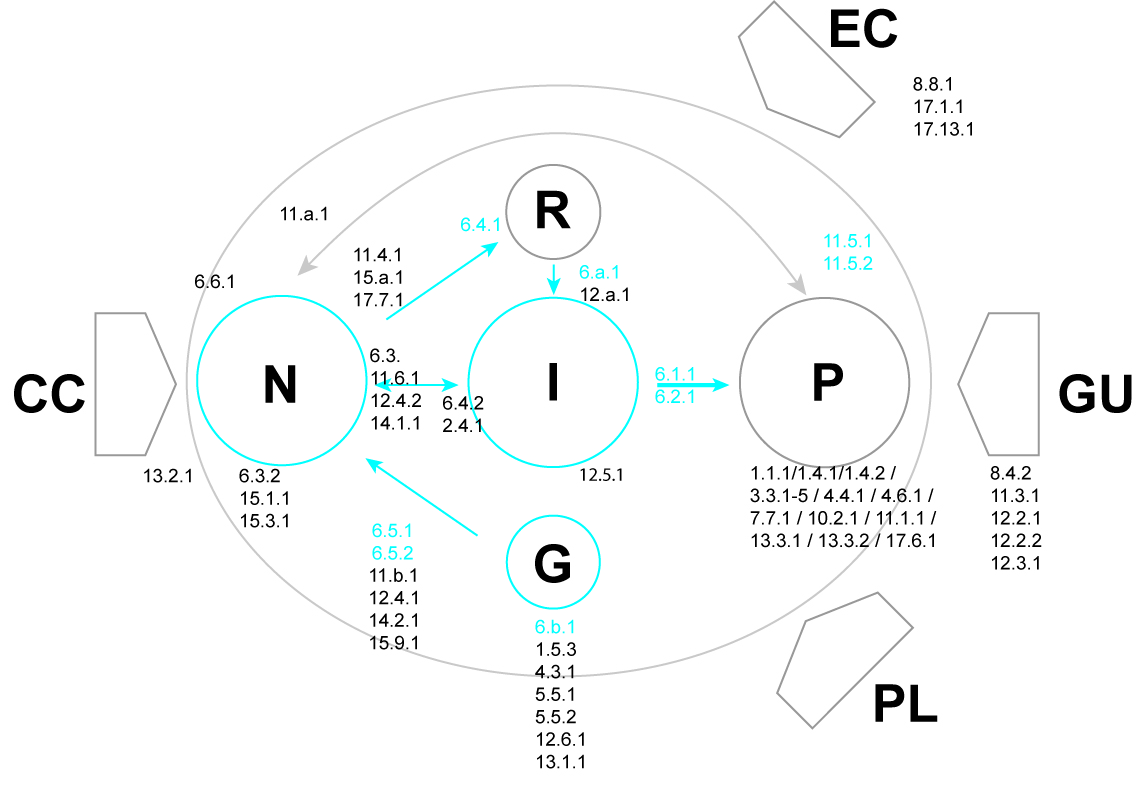
To test the diagram, I associated the Sustainable Development Goals with each section of the diagram:
Citation
@online{butte2024,
  author = {Butte, Giacomo},
  title = {Water {Security} as a Diagram},
  date = {2024-04-11},
  url = {https://www.giacomobutte.com/blog/water_security/},
  langid = {en}
}